Daily Kos reports:
If people were dropping out of the workforce because they were getting wealthy then we shouldn't care about this. But that is not the case. In contrast, the participation rate of older workers has dramatically increased.
The headline economic numbers are far better now than in 2008-2009. The unemployment rate, the GDP, the national deficit, the stock market, etc. have all improved.
Yet many of us can't shake the feeling that things are still stuck in 2008. Well, you aren't crazy.
Many areas of the economy have never recovered from the 2008, and some are even worse today.
Does this mean things aren't better than in 2008? No. But it does mean that most comparisons between this "recovery" and recoveries in the past are flawed. This one is different.Child Poverty
What sort of recovery has Increasing numbers of children in poverty?
There are nearly two million more children living in poverty in the U.S. today than during the 2008 recession, shocking new figures reveal.The rate for black children is a whopping 38%. The overall poverty rate is down from 2012, but still higher than 2008.
Nearly a quarter of youngsters (22 per cent, or around 18.7million children) - were classed as living below the poverty line in 2013.
This has risen from 18 per cent in 2008 (16million youngsters), according to the Casey Foundation's 2015 Kids Count Data Book.
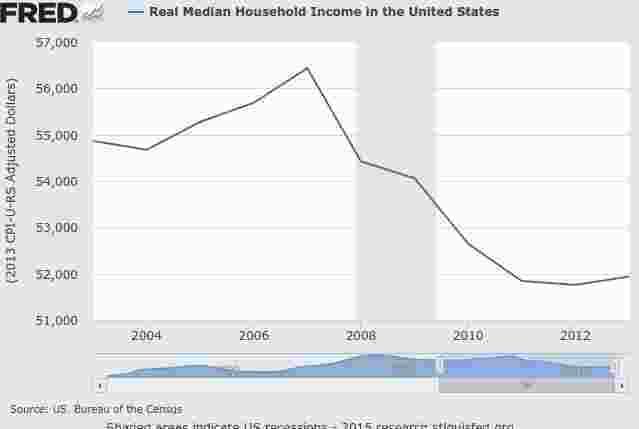
Household Income
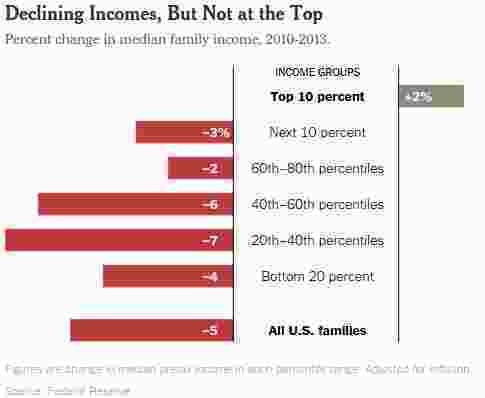
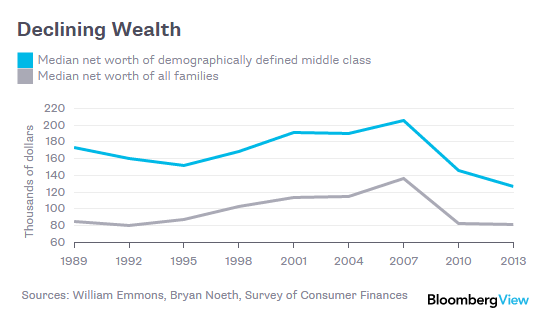
Almost every month Wall Street is surprised by the fact that household incomes aren't bouncing back from the recession. This "new normal" has led to a decline in the middle class.
In the late 1960s, more than half of the households in the United States were squarely in the middle, earning, in today’s dollars, $35,000 to $100,000 a year. Few people noticed or cared as the size of that group began to fall, because the shift was primarily caused by more Americans climbing the economic ladder into upper-income brackets.
But since 2000, the middle-class share of households has continued to narrow, the main reason being that more people have fallen to the bottom.
Since 2008, the number of Americans who view themselves as middle class has dropped from 53% to 44%, with the largest drop between 2012 and 2014. There is a similar increase in the number of people who view themselves as lower class.
Much of this can be seen in the 50% growth of temporary workers.
Homeownership
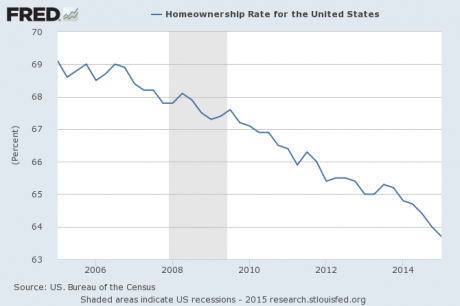
The subprime housing bubble burst years ago, but the homeownership crisis is still playing out.
The U.S. homeownership rate continued to decline in 2015, hitting its lowest level since 1989.The declining trend hasn't moderated at all, and we've long since retraced the housing bubble.
The seasonally adjusted homeownership rate declined to 63.8% in the first quarter of 2015 compared with 65% in the first quarter of 2014, according to estimates published by the Commerce Department on Tuesday.
New Businesses
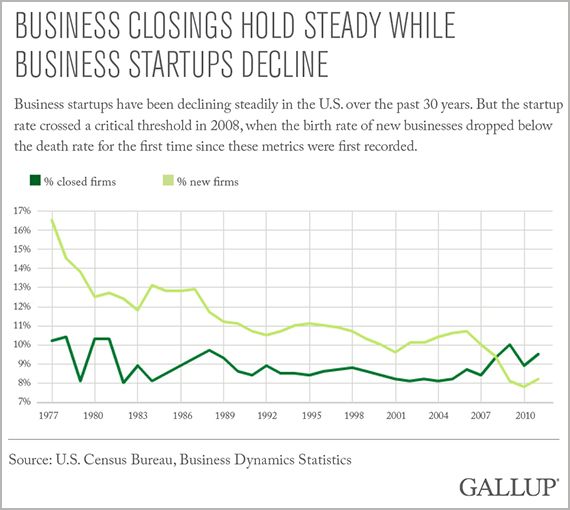
Fewer and fewer Americans are starting small businesses. In fact, more are going out of business than starting businesses.
What's more, this trend is especially pronounced in school-debt burdended millenials.
"Saddled with student loan debt, millennials can't afford to be entrepreneurs," according to 2015 state of entrepreneurship report from the Kauffman Foundation, a nonprofit devoted to studying entrepreneurship.Lack of personal savings and difficulty at getting financing are the primary reasons.
Start-up rates among Americans ages 20 to 34 peaked at 35 percent in 1996 and has since declined to 23 percent in 2013, according to Kauffman.
Labor Force Participation
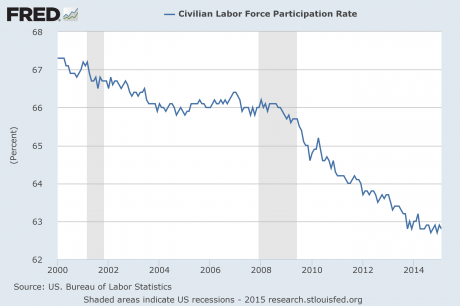
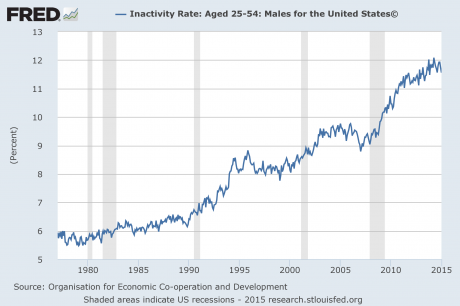
Many people have commented on the drop of people in the workforce, the primary reason for the drop in the unemployment rate, and most of it is because of demographics (i.e. Baby Boomers retiring). However, not all of it is because of demographics.
The US labor force participation rate has fallen by about three percentage points since the Great Recession. Of that decline, Barclays thinks two points are due to population aging. The rest it blames on less participation within various age groups. Now overall, the US still has participation rates higher than Germany, Japan, and UK — the other large, advanced economies Barclays examines in a new report. But US participation dropped a lot more than those nations between 2005 and 2014. And it has particularly dropped a lot for working-age Americans versus that age group in other nations.
If people were dropping out of the workforce because they were getting wealthy then we shouldn't care about this. But that is obviously not the case. In contrast, the participation rate of older workers has dramatically increased.
Wealth Inequality
Not surprisingly, wealth inequality just keeps getting worse.
Before the impact of tax and spending policies is taken into account, income inequality in the United States is no worse than in most developed countries and is even a bit below levels in Britain and, by some measures, Germany.
However, once the effect of government programs is included in the calculations, the United States emerges on top of the inequality heap.
That’s because our taxes, while progressive, are low by international standards and our social welfare programs — ranging from unemployment benefits to disability insurance to retirement payments — are consequently less generous.
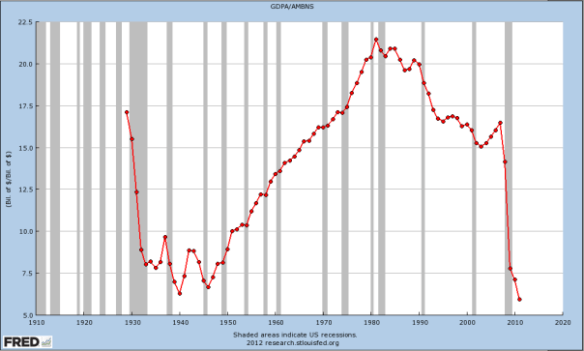
America's inequality problem has entrenched the lack of social mobility. This gets justified by the "Horatio Alger myth". Since some commenters have mentioned it, I thought I would add this graph of monetary velocity.




0 comments:
Post a Comment